Keltner Channel: what it is and how it works
March 13, 2024
5 min

A Keltner Channel is a technical analysis indicator that measures an asset’s volatility. Graphically, it consists of bands containing the price of a cryptocurrency, a stock, a bond, or a commodity.
The positioning of these bands is decided by measuring the volatility or average-true range (ATR), which are very useful for analysing trend changes or continuations. Learn in detail what a Keltner channel is and how it works.
What is a Keltner Channel
To understand the Keltner Channel, we can start with its history. The name of this volatility index comes from the surname of the analyst who invented it. Chester Keltner introduced this useful trading tool in 1960 by using a simple moving average to determine the positioning of the bands.
Nothing changed until 1980, when a new formula was discovered to derive the average true range (ATR), one of the most widely used volatility measurement tools still used today.
After providing some context, let’s address the central theme of this article by answering the question: “What is the Keltner Channel?”. This technical indicator based on volatility consists of three separate lines. An exponential moving average (EMA) is usually used as the benchmark, i.e. the centre line of the channel.
Then, there are two other lines, the bands we have already addressed in the introduction. These are extracted using the average true range (ATR) and expanded or contracted depending on how volatile the asset price under consideration is.
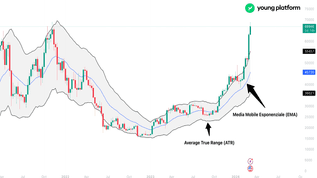
Price action exits channels in periods characterised by a high degree of volatility. For example, below is the chart of Bitcoin after an explosive bullish movement. As can be seen, its price, which had remained within the Keltner Channel, exited the zone after the pump, given the limited level of volatility.This usually happens when there is a change in trend or an acceleration of movement.
Keltner Channel: how to use it
This instrument has many possible uses, and it depends very much on the type of signals each trader is looking for to open a position. If used on larger time frames, it may react with a certain delay (lag) to price changes. Conversely, as the time frame analysed increases, the Keltner Channel becomes faster but, perforce, less accurate, given the smaller amount of historical data at its disposal.
When setting the Keltner Channel, one can also choose the time frame on which to use it, taking these main conditions into account:
- The angle of the channel helps to identify the direction of a trend. If it is upward, the price will also move upwards. Conversely, if it is downwards or horizontal, the price will either be lateralising or moving downwards;
- An upward break of the upper band is considered a signal of strength. If, on the other hand, the lower band is broken to the downside, the asset in question is in a moment of weakness.
- Some oppositely use this signal, i.e. in a predictive way, trying to predict the behaviour of the markets. Primarily if the long-term trend is well-defined. During an uptrend, a trader might wait until the moving average in the middle of the bands reaches the lowest point of the Keltner channel to enter the market.
Keltner Channel: the parameters
Finally, to understand what a Keltner Channel is and how it works, we cannot fail to analyse the parameters you can act to set this indicator. These are mainly two:
- Number of Bars: This parameter, known as ‘Length’ or ‘Period’, determines the number of bars (or periods) used to calculate the Keltner Channel’s central moving average. This value defines the time frame over which the average is calculated and influences the channel’s sensitivity to price changes. A higher value makes the channel less sensitive to price fluctuations, making it more stable, while a lower value makes the channel more sensitive, adapting more quickly to price changes;
- Factor: This parameter, also called ‘Multiplier’ or ‘Bandwidth‘, determines the width of the outer bands or channels of the Keltner Channel. The factor is multiplied by the average true range (ATR), a measure of market volatility, to define the distance of the upper and lower bands from the central moving average. A higher factor generates wider channels, which may be helpful in times of high volatility, while a lower factor produces narrower channels, which may be better in times of less volatile markets;
Now that you know the Keltner Channel and how it works, you can test it on our dedicated cryptocurrency exchange for traders: Young Platform Pro. You will find all the most popular trading indicators on it.


