The Psychology of Market Cycles and Sentiment Indicators
July 1, 2021
8 min

Although financial topics are becoming increasingly popular, it is not easy to figure out how to navigate in this world of charts, numbers and percentages. It is also a question of luck, because it is not always mathematical to predict how and in which direction the market will move. The important thing, however, is to be informed and understand the dynamics at play.
The emotional component in investing and trading
The cliché that emotions and numbers are not compatible has been debunked. However analytical and objective equations or percentages may be, the world of investing and trading is an emotional one. This is not a bad thing, quite the contrary.
It means that how you need to trade depends not only on mathematical analysis. It depends on your goals, preferences and (why not) even your mood. After all, it is not a computer that invests (mostly), but a human being.
You have to consider both the psychology of the individual and the psychology of the market composed of investing human beings.
What are market cycles?
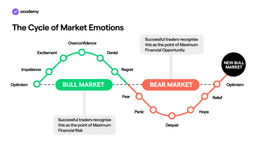
Under the microscope, the market is made up of ups and downs, but more complex curves and patterns can be identified within the charts. Experts identify two types of market movements:
- Bull Market
- Bear Market
Bull market
The bull market phase starts from the moment a new asset is discovered until it reaches its highest peak, the buyers’ excitement. When investors discover a new asset or currency and everyone is talking about it, the hype starts. Everyone wants a piece of it.So, the asset starts to gain value. At this stage, investors’ confidence also increases, as they continue to believe in the asset and drive up its value.
Then comes the peak, the overconfidence. The asset has reached its maximum value and all traders continue to believe in it and keep it high. This is the highest point in the market, the absolute top. Investors believe that the price will always continue to rise because “this time it is different”. This can be the result of speculation, if the value doesn’t correspond to the intrinsic value.
However, the upward and positive trend cannot continue forever.
Bear Market
At the first signs of a downturn, the first instinct among investors or traders is denial and complacency, justifying the red flags by telling themselves it is a fleeting correction. This is because the confidence instilled by the bull market is excessive.
This phase is also called “distribution” because investors who bought before the price rally start selling at a profit. At this time, most traders are unsure whether to exit before the price falls or stay in the market in case it is a temporary stall.
As the value continues to fall, remorse begins to set in for not selling or even buying too late. Then we enter the heart of the downward curve and panic sets in.
Here, different feelings are mixed and indecision dominates. In doubt, many choose to exit their positions, causing a further collapse.
From drop to drop comes a domino effect that fuels fear, uncertainty and doubt (FUD).
We arrive at the bottom of the cycle, at one of the first support lines. Here traders have completely lost hope and faith in the asset.
Many, however, know that this point in the cycle can be a good time to buy, and if along with them, external factors bring the price back up, a little hope is reborn. This, however, is combined with a scepticism given by the trauma suffered in the middle of the Bear Market phase.
Cognitive biases activated during market cycles
Biases are the often unconscious behaviours of traders. These biases can manipulate the market participants in such a way that investors can no longer make lucid and objective decisions.
To learn about some biases, read the dedicated article.
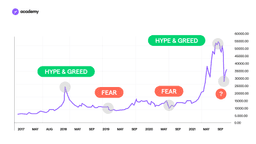
The bull phase is characterised by FOMO (fear of missing out). FOMO prompts investors to make moves that have not been properly calculated. For example, buying when everyone else is buying.
The bear phase, on the other hand, instils FUD (Fear, Uncertainty and Doubt), a different kind of fear, which drives people out of the market. It is the one where everyone sells, seeing that most of the market is selling, without doing their own prior analysis.
These behaviours caused by cognitive errors and emotionality are typical of trading, although the industry does not like to talk about the emotions involved.
The fear of losing savings can make people sell too quickly, while the fear of being left with nothing can leave people with investments of little value. Conversely, the excitement of a new market launch can make people buy too quickly. The market cycle is a physiological trend and is made up of ups and downs.
Market sentiment indicators
Market sentiment
Market sentiment is the overall attitude of investors towards a particular asset or the market as a whole. It is the sentiment and psychological trend that emerges from a market, based on market data and price movements or media content.
Bull markets are therefore characterised by FOMO, greed and optimism, while bear markets are characterised by pessimism and fear, in short FUD.
There are a number of market indicators that can signal either sentiment and thus give us clues as to the price trend.
Crypto Fear & Greed
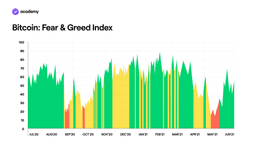
For example, we have the Crypto Fear & Greed Index, which measures greed on one hand and fear on the other to determine whether the currency is more likely to go down or up.
It is based on trading volumes, open interest on exchanges and takes into account data from social media and search engines.
The values on the Fear and Greed Index range from 0 (extreme fear) to 100 (extreme greed).
The zones on the chart are separated as follows:
- 0-24 = Extreme fear
- 25-49 = Fear
- 50-74 = Greed
- 75-100 = Extreme greed
You could argue that when the market is approaching or is in the ‘extreme greed’ zone traders are getting too greedy and the market is waiting for a correction.
Similarly, we could say that when the market is in the ‘extreme fear’ zone, traders are too fearful and we may soon reverse course.
Spent Output Profit Ratio
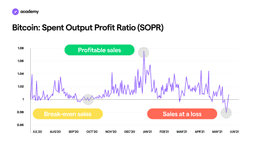
The Spent Output Profit Ratio (SOPR) is an indicator that provides a macro view of market sentiment, profitability and losses incurred in a particular timeframe. It reflects the degree of profit made for all bitcoins transacted on the blockchain.
Values fluctuate above and below 1:
- Values above 1 imply that the coins transacted that day are, on average, sold at a profit (the price sold is higher than the price paid).
- Values below 1 imply that the coins transacted that day are, on average, sold at a loss (the price sold is lower than the price paid).
- When the value is very close to 1, it signals break-even sales (the price sold is similar to the price paid).
Profitable sales (>1) indicate success, and therefore greed or lack of any bias.
Sales at a loss (<1), on the other hand, indicate strong fear and pessimism, but also a lack of experience.
There are many other indicators and technical analysis tools that we will gradually explore, but for now, we feel it is important to emphasise that studying indicators is one of the things that helps to form the awareness and discipline with which you can protect yourself from cognitive biases.


