Technical Analysis: Start With The Basics
May 4, 2022
11 min

Technical analysis is a fundamental part of trading strategies in any market, thus also for crypto trading. There are several useful tools for understanding price movements and market trends: supports and resistance, trendlines, moving averages.
So let us try to understand what technical analysis is, starting with any candlestick chart: mind you, technical analysis is not a message from the future. It is simply a guess, more or less accurate and never 100 percent certain. The success of your trades will depend on you and your understanding of what is meant by technical analysis.
What technical analysis is: predicting behaviour
Firstly, the best way to find out what technical analysis is, lies in understanding its purpose. Why do we need to read charts, draw lines and exploit indicators? To understand the state of the market, i.e. the price trends created by traders’ buying and selling relationships, and eventually to participate and make the best trades for ourselves.
Technical analysis is of particular importance in crypto trading: the fluctuation in the value of cryptocurrencies is mainly determined by the law of supply and demand, i.e. the willingness of traders to buy and sell crypto. Unlike traditional financial markets, cryptocurrency trading can also be free of intermediation. Of course, the order books of centralised exchanges host large volumes of buying and selling, but these environments are not the only ones for cryptocurrency trading: there are decentralised exchanges (DEX) and other forms of peer-to-contract exchanges, i.e. interactions between users and smart contracts of certain protocols.
Supply and Demand
In economics, supply and demand correspond to the two main actions of trade. They represent the buying and selling pressure of goods, services or assets. In macro and micro economics, the two concepts take on the meaning of quantity of consumption requested by the market (demand) and quantity of goods available (supply). The two values are then quantified and related in order to understand and analyse trends in an industry. In the crypto sector, they are the two leverages that determine the price of a cryptocurrency.
To understand what technical analysis is, we must observe the inevitably human behaviour of traders: what moves the market is the synthesis of all their actions. This could be efficient or irrational, so the effectiveness of your operations will come from your ability to understand and anticipate them. It is the sum of the market participants’ choices that form supports, resistances and trendlines, the basic tools of technical analysis. Identifying them could give us an idea of future trends, so that we can exploit them with the best strategy, although these are only forecasts, sometimes contradicted by the reality of the facts.
Candlestick chart, supports and resistances
Basic technical analysis is carried out directly on cryptocurrency price charts. Therefore, to understand what technical analysis is in concrete terms, the first tool to know is the candlestick chart.
You may have seen, in the Young Platform exchange, charts consisting of red and green vertical bars, the so-called ‘Japanese Candles‘. Candlesticks in trading are particularly useful because, given a time interval, they visually summarise information about price movements (Open, High, Low and Close). Candlesticks are much more detailed representations of market trends than a line chart, so they are the perfect basis for technical analysis.
Trading charts paint the outcome of any clash between supply and demand: green marks the satisfaction of demand, red proclaims the dominance of supply. Like any painting, however, candlestick charts are subject to analysis and interpretation. The market canvas, however, has no axes of symmetry or vanishing points: perspective, in crypto trading, is determined by support, resistance and trendlines.
Trading
To buy and sell cryptocurrencies according to the price movements of the market, in order to gain a profit
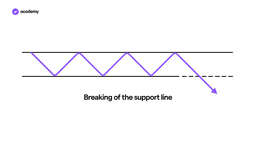
Support and resistance are key price levels for understanding the performance of a cryptocurrency: identified by horizontal lines, they enclose market movements within certain boundaries, within which trading is most likely to occur. Specifically, a resistance is an upper boundary in a cryptocurrency’s price chart, while a support is its lower counterpart.
Let’s imagine, then, a pinball (the market), in which a ball (the price) bounces between two barriers: having reached a support zone, it may gain momentum thanks to a possible buying pressure; until then, however, the price will continue to run by inertia at this level. When, finally, the bullish momentum is sufficient, the price-ball will rebound, until, however, it meets the resistance zone barrier. At this level, similarly, the price will hold back until the selling pressure is such that it is forcefully repelled, or new buying volumes allow it to continue its ascent.
When the market is unable to break through support and resistance zones (either upwards or downwards) then it clearly does not have the strength to continue in a defined direction: supply and demand have equal strength, so the struggle lasts longer. However, it is the ‘breaking‘ of supports and resistances that is the most important event for technical analysis: a push above a resistance creates a potential bullish trend, just as a descent beyond a support could define the fall into a bearish trend.
Market trend
The market trend is the price movement that a particular market is going through or has gone through. It can be bullish, bearish or lateral. The trend is studied for both historical analysis and forecasting.
There is no absolute method for identifying support and resistance lines: you could look at the chart and look for levels that have seen the price ‘bounce’ in the past. Given the overtly psychological nature of supports and resistances, the same event is likely to occur again at these levels. However, it is important to watch out for a plot reversal: a sudden break-up could reverse the references, turning resistances into supports or vice versa.
However, in order to catch bullish and bearish trends, technical analysis also observes the breaking of other lines, in addition to those of support and resistance: trendlines, oblique lines that connect price highs or lows.
Trendlines: bullish or bearish?
Trendlines, like supports and resistances, are drawn in charts: they connect points on the chart that represent price lows or highs within a certain time period. These trendlines thus make it possible to identify market trends; in technical analysis, two in particular are identified:
- Trendlines connecting increasing minima, i.e. rising prices, identify a bullish trend.
- Trend lines that, on the other hand, form with decreasing highs, where each price is therefore lower than the previous one, demonstrate a bearish or bearish trend.
Bear markets and bull markets, however, are not the only trends that exist: there can also be a ‘sideways phase‘ for the price, in which the value of a cryptocurrency remains stable, not taking a precise direction.
Curiosity
The terms ‘bear’ and ‘bull’, in reference to the market, probably derive from the way the two animals attack hostile entities: a bull girds and throws up enemies, while a bear grabs opponents, trying to drag them down and land them with its weight.
Once trendlines have been drawn over the time interval of interest, the trader will combine them with other technical analysis indicators to assess the strength of the trend. This is to understand whether it is rising or falling, making a reversal likely.
Based on the outcome of his advanced analysis, a crypto trader will set sell or buy orders that make the most of one of the two possible outcomes.
Traders, however, do not usually sell or buy immediately, as someone buying their first cryptocurrency might do ‘with a click’. Instead, they use advanced orders such as limit orders and stop orders: essentially, features of exchanges that schedule the execution of a certain transaction under certain market conditions.
Having dealt with supports, resistances and trendlines together you may have understood what is meant by technical analysis but, if you haven’t exhausted your curiosity, you may also be interested in how moving averages work!
Moving Averages: Golden Cross and Death Cross
Technical analysis cannot be based solely on supports, resistances and trendlines: these tools are a first key to reading the market, to familiarise yourself with its dynamics and trends, but they are only a few pieces of the technical-analytical framework required of a professional trader.
Crypto trading needs other indicators to attempt any kind of prediction: among them are moving averages (Moving Averages, MA). In a nutshell, moving averages are ‘trend following‘ tools, i.e. based on past data, actually used to confirm trends rather than predict them.
Two types of moving averages (MA) are usually used:
- Simple Moving Average (SMA): represents the average price of a certain cryptocurrency (or asset) over a certain period of time. By choosing the last price of each of the days considered, it calculates the arithmetic average, updating it as time passes. Thus, we will always have the average price of the ‘last n days’, which is why it is ‘moving’.
- Exponential Moving Average (EMA): unlike the SMA, it gives more weight to more recent prices. Its greater sensitivity to what is current makes it more suitable for short-term strategies.
However, it is the combined use of several moving averages that is interesting for technical analysis: by observing the interaction between long-term and short-term moving averages, bearish or bullish trends can be confirmed
In particular, it is the ‘crossover’ of two moving averages that is important:
- Golden cross, bullish crossover: a short-term MA outperforms a long-term MA, retrospectively confirming the start of a bullish trend
- Death cross, bearish crossover: a short-term MA crosses a long-term MA downwards, marking the start of a bearish trend.
Usually, a 50-day EMA is used for the short-term moving average, and a 200-day SMA for the long-term. These ‘signals’ will be more significant if displayed in broad time-frames: a daily crossover is more indicative of a trend reversal than a 15-minute cross, for example.
Golden crosses and Death crosses are strong confirmations in Bull Market and Bear Market situations: if you want to learn more about moving averages and discover other signals, check out the dedicated article in the Academy.
Do you understand what technical analysis is? If you are looking for further explanations on the instruments mentioned, you will find useful links in the text, as just above for moving averages. They will lead you to other Academy articles, specific to supports and resistances, trendlines and candlestick charts. This study will be the prerequisite for all your technical analysis! It is important to do your own research (DYOR), learn how the tools work and determine your risk profile before buying cryptocurrencies: technical analysis provides hypotheses, never certainties, so always compare multiple indicators and be flexible to refutations.


