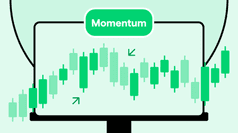
Momentum indicator: measuring the strength of an asset
March 14, 2024
5 min

The most straightforward explanation to the question ‘What is the Momentum Indicator?’ is a measure of the speed of price changes of a tradable asset, e.g. a stock, a bond or a cryptocurrency.
For a more specific definition, it can be added that it shows the rate of change of price movement over a given period and helps investors determine the strength of a movement.
Over time, this statistical value has become an indicator seen on charts and used by traders to support their strategies. Find out in detail what the Momentum Indicator is, how it is calculated and what it is used for.
What the Momentum Indicator is and what it is used for
The term itself expresses, at least in part, what the Momentum Indicator is in trading. This measure represents, on the chart, the ‘strength’ of a particular price movement, in jargon referred to as a ‘trend’. It does this by comparing the current performance with the past performance of an asset.
It is essential to remember that this tool cannot be used to predict trend reversals. It merely calculates the probability that a bullish or bearish trend will continue over time.
This is why it is a helpful indicator for traders wishing to confirm or refute the thesis that led them to plan a particular strategy or enter the market at a specific time.
Momentum Indicator: How it works and how it is calculated
The Momentum indicator (or oscillator) compares the current value of an asset with its past value and calculates the percentage change. It does not perform this calculation just once but for each point on the chart. In this way, the trader is given a line that oscillates as the parameters listed above change.
A unique feature of this oscillator is that it has no limits. In other words, it could take on virtually any value. If, for example, the price of Bitcoin were to rise indefinitely, so would the Momentum indicator.
This over-optimistic example allows us to discuss another essential feature of this measure: its direct proportionality relationship with volatility. The more the price of the stock, cryptocurrency or commodity in question varies over time, the higher the value the oscillator assumes.
Finally, it should be specified that the volatility of each asset is subject to change over time. Bitcoin’s last price movements (January – March 2024) were characterised by high volatility, mainly upward, which can be observed on the Momentum indicator.
The formula to calculate it
Having understood the Momentum Indicator, we can look at the formula to be applied to calculate it. The formula we will consider is the simplest possible to calculate this type of indicator but also the most intuitive:
Momentum = (Pa / Pn) * 100
The numerator (Pa) indicates the asset’s current price, while the denominator (Pn) is its price for a number of periods. This interval is the ‘number of bars’ or ‘period’, the most essential variable to consider when setting this indicator.
The number of bars of the Momentum indicator
The indicator’s ‘number of bars’ (‘Period’ or ‘Length’) represents the number of periods used to calculate its value.
This parameter defines the time period for which the Momentum is calculated. It is calculated as the difference between its current price and the closing price of several previous periods.
The ‘number of bars’ determines this time frame. For example, suppose the Momentum indicator is set to a ‘number of bars’ of 10. In that case, it will be calculated based on the difference between the current price and the closing price of 10 previous periods (which could be days, hours, minutes, etc., depending on the time scale used).
This parameter influences the indicator’s sensitivity to price changes. A smaller ‘number of bars’ makes the indicator more sensitive to recent price changes, while a more significant number makes it less sensitive, reflecting long-term trends instead.
How to use it in trading
As mentioned, this indicator is usually used as a confirmation tool. That said, knowing what Momentum is and how it works also means knowing the scenarios where it is particularly effective. Here they are in detail:
- At the breaking of supports or resistances.
- When there is a divergence between the indicator and the chart, that can be used as a signal to confirm the strength of the trend.
- In the event of a trendline or channel break.
- In the window of time when a piece of news is causing major price movements.
- In general, on all occasions when an emerging or dying trend needs confirmation.
Now that you know what the Momentum indicator is and how it works, you can try using it on Young Platform Pro, our dedicated cryptocurrency exchange for traders. You can also try setting up one of our automated strategies using it. What are you waiting for? Log in to the app and try Smart Trades!


