Technical Analysis: How to Draw Trendlines
June 7, 2022
9 min


Trendlines are a simple yet effective tool in technical analysis preparatory to trading. As straight lines, they geometrically pass through two points which, in economic trend charts, correspond to prices. In this article you will learn more specifically what trendlines are, how to draw a bearish (or bullish) trendline and, through practical examples, how to use trendlines in trading.
What is a trendline: price indicator
One of the basic tools a trader can use in technical analysis are trendlines, which are extremely useful for trying to interpret normal fluctuations in financial markets, especially for cryptocurrencies.
The trendline indicator, as its name implies, helps the trader to derive the meaning of a market trend. As a result, one can identify a bullish or bearish trend and adjust one’s trading strategy accordingly.
Trendlines, therefore, aim to predict future price movements and make sense of current ones.
How to draw a trendline: between lows and highs
In general, trendlines are simple straight lines connecting two chosen points. In fact, they join point A to point B, resulting in upward, downward or horizontal lines, parallel to the x-axis of the trendline graph.
So, in order to understand how to draw a trendline, we must carefully choose our points A and B: they must represent minimums or maximums in the price fluctuation, i.e. respectively the lowest and highest value reached over a certain period of time.
The highs and lows are usually rising or falling (i.e. greater or less than the previous ones), thus defining bullish or bearish trendlines; on the other hand, if the resulting straight lines were perfectly horizontal, these would function exactly as supports or resistances. However, a trader might also consider trendlines with a slope as dynamic supports or resistances, i.e. changing position over time.
In order to draw a trendline, and identify the market trend, we must then find at least 2 highs (or lows) and join them with a straight line. This means that in cryptocurrency trend charts (or any financial market), the price must ‘touch’ our line at least twice.
The trendline can also touch more than 2 points, potentially signalling further confirmation of the assumed trend.
How to use trendlines: predicting the market
Drawing a trendline is the first step, the second is to understand what the trendline highlights. In fact, we may be faced with two main market trends:
- Bear Market – By identifying falling highs, the slope of the trendline will be downwards, defining a bearish trend. The lows, in the space between the two highs, could be indistinctly rising or falling, but will not affect the bearish macro-trend.
- Bull Market – If rising lows are detected, the slope of the trendline will be upwards, defining a bullish trend. Of course it is possible to draw trendlines in specific areas of the chart, but the main interest will always be the general market trend. Thus, although there may be local descending highs, it is the rising lows over broad periods that will define a bullish market.
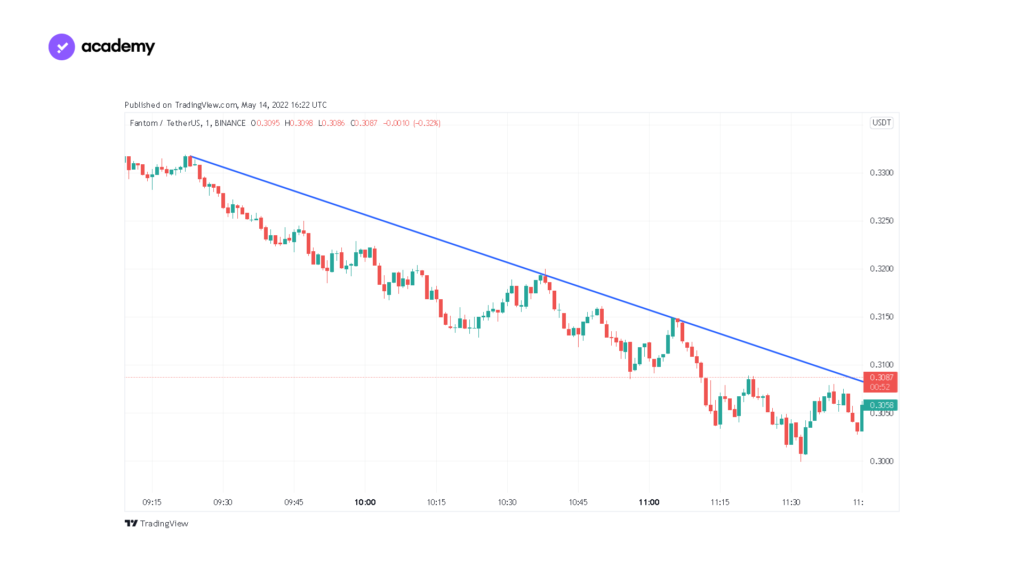
Below is an example of a bearish trendline, drawn on the FTM-USDT chart, confirmed by three highs:
Clearly it is possible to use several trendlines simultaneously, not just the ‘canonical’ bullish and bearish ones. This will increase the accuracy of technical analysis, especially when using different timeframes (time periods).
Here are some practical examples:
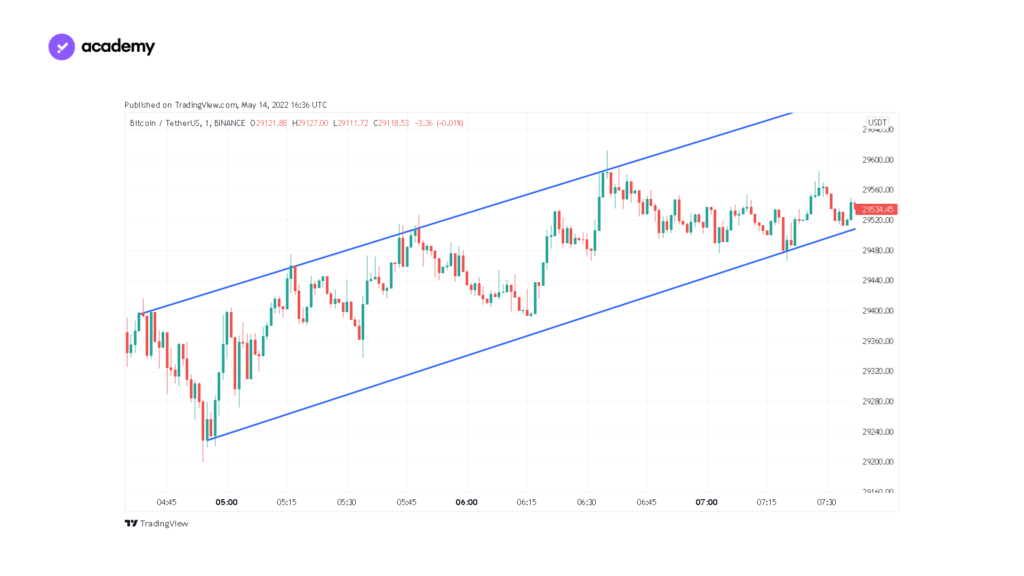
1. Creating channels – by drawing a trendline at the top of the movement (connecting the highs) and another at the bottom (connecting the lows) it is possible to find ‘channels‘ within which the price fluctuates.
These can be ascending, if the price goes up, or descending if, on the contrary, the price goes down.
The price trend usually tends to respect the limits of the channel, staying within it, but being influenced by the law of supply and demand, a characteristic of cryptocurrency trading, it is likely to fail to keep to the charted path. This could suggest a change in the market trend, or simply a false ‘break’ in the channel.
Always bear in mind that trendlines, although useful and easy to draw, are a crude tool, and should be used in combination with other technical analysis indicators.
Let us see an example of an ascending channel in the graph of the BTC/USDT pair:
2. Large and small timeframes – the usefulness of trendlines is obvious in different timeframes. Moving from a larger timeframe to a narrower one (from 1D to 1H for example), the resulting trendlines will have a different meaning: the closer the timeframe is to instantaneous, the greater the ‘sensitivity‘ of the trendline. Indeed, minimal events and fluctuations may be recorded, but ‘precise’ timeframes sacrifice the overview.
In a nutshell, in the 5-minute chart, you will observe changes that have short-term significance, while in time-frames longer than 24H you can make long-term estimates. Define your strategy and choose the best time frame accordingly.
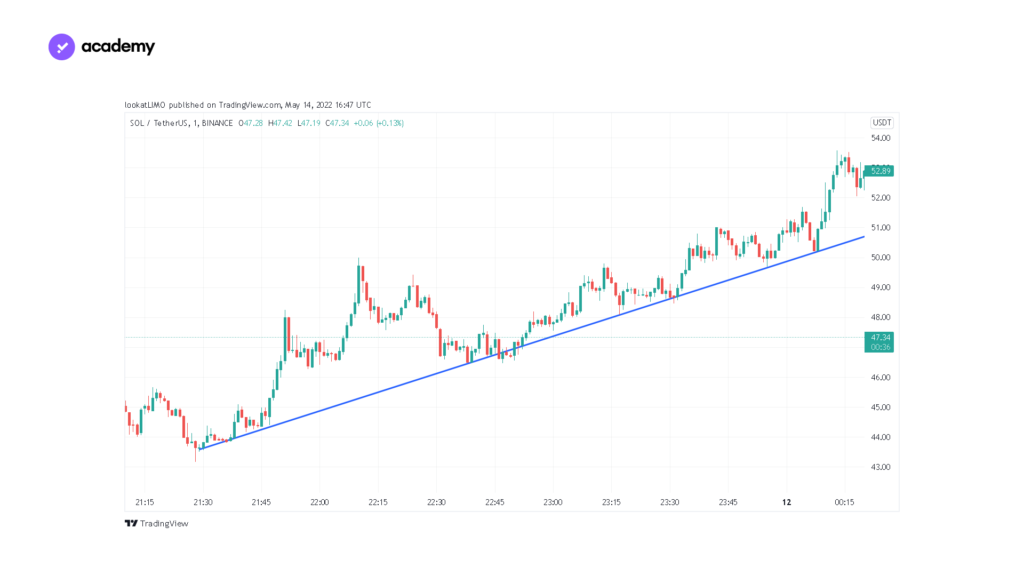
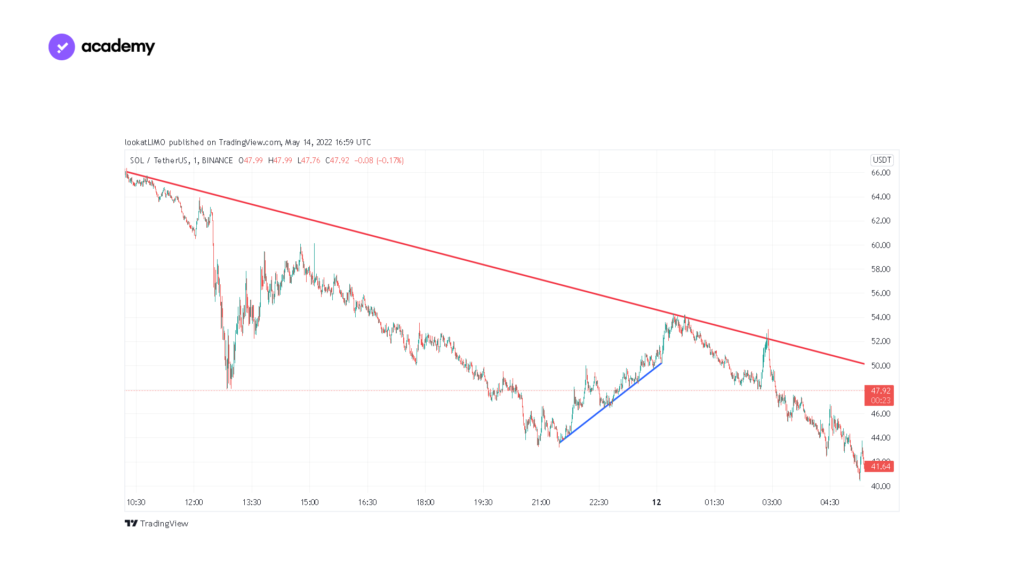
Below is an example on SOL/USDT: Looking at the same time coordinates in two different time-frames, the bullish micro-trend of the 1-minute candles, in the daily oscillation a bearish trend is inserted. These are not conflicting forecasts, but simply valid in different timeframes.
Rebound, break and confluence: trendline trading
Once we have drawn trendlines, having understood how to use them, we should behave according to our forecasts, regardless of emotion. In fact, there are 3 main strategies for trendline trading, which are extremely objective, based on factual trendlines and other statistical indicators:
1.Bounce on the trendline – having drawn a trendline (bearish or bullish), you will set up trades that follow the observed trend. For example, buying at the beginning of a bullish trendline could be profitable (should your prediction be correct). Buying at the ‘bounce’ of the price on a bullish trendline is a popular strategy, as is selling when the price swing approaches the peak marked by a bearish trendline.
This strategy can also be applied to swing channels: selling near the upper edge and buying at the lower edge. No matter the trend, the important thing is that the price moves!
2.Trendline break – the break, and potential reversal, of the trendline is another interesting trading signal. A trendline break occurs when the price falls above a bullish trendline or crosses a bearish trendline. Thus, a Bull Market could turn into a Bear Market, or vice versa, if the time-frame is large enough. Consequently, you could set limit orders and stop orders to intercept trend reversals.
However, as with swing channels, it is important to watch out for ‘false breaks’, which would cause Bear Traps or Bull Traps, i.e. ‘traps’ for traders with forecasts opposite to the real trend.
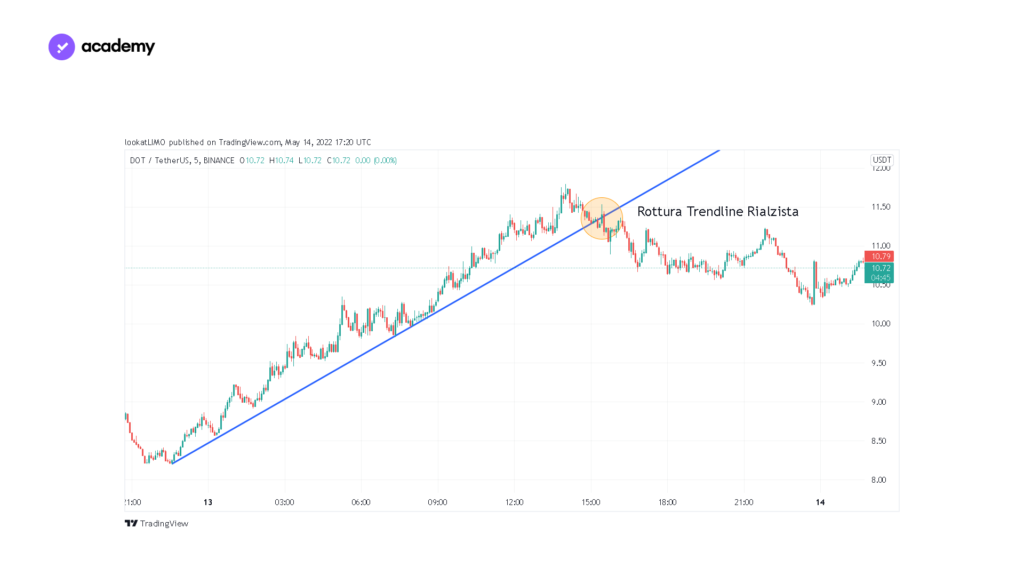
Below is the break of a bullish trendline in the DOT-USDT chart:
3. Confluences – As mentioned above, trendlines are effective tools but are sometimes too imprecise. Therefore, most traders combine trendlines with additional indicators. Confluences occur precisely when several technical analysis signals are in agreement with each other. This will support the forecast given by the trendline drawn.
To take advantage of confluences, trendline analysis can be combined with moving averages, candlestick patterns, the RSI (Relative Strength Index) oscillator and above all with supports and resistances.
Trendlines in Technical Analysis
Drawing trendlines can give important hints on market trends, especially in trading. However, any indicator can be fallacious: as the value of cryptocurrencies is subject to the behaviour of traders, trendlines will only be useful if they are observed and respected by the majority of the market. Imagine if more than half of the traders, instead of buying, sold at a bullish trendline: the price would break the trend, generating losses in the portfolios of ‘bullish’ buyers.
This is why experts combine several indicators and always protect themselves against the specific risk of their strategy: remember not to invest more than you are prepared to lose, do your own research (DYOR) and above all that no one can ever be sure of what will happen: technical analysis is not a crystal ball!
Related