Technical Analysis: How to Identify Support and Resistance
March 5, 2024
7 min


What are supports and resistances? Traceable lines in price charts: a tool in the technical analysis of financial markets that is very useful for trading. In particular, supports and resistances define boundaries within which price should move. Indeed, in the vicinity of these levels, traders’ behaviour could lead to different trends, predictable but not certain, influenced by their psychology. However, to embark on the best strategy, we need to find out how to identify supports and resistances, even before confronting technical analysis.
What are supports and resistances?
One of the essential elements of any trading strategy is correct chart reading. The first step in the technical analysis of financial markets coincides with identifying key price levels, which are very useful for understanding the market trend and possible future price behaviour of an asset.
Support and resistance levels highlight the behaviour of all players operating in a financial market, which gives them strong behavioural and psychological relevance.
Support
A support is the level at which the price, in a bearish phase, stops its fall and potentially rebounds upwards again
The support level is very useful because it allows you to understand how the price might In other words, a visible level on the chart hinders the descent of an asset’s price. Identifying these demand zones is very useful because they suggest how the price might behave nearby and consequently inform the most appropriate trading strategy.
Resistance
Resistance is the opposite of support. It is a level that hinders the price from rising and is located at a point on the chart from which the asset in question could bounce back down.
Resistances are extremely useful in a bullish market because they allow you to understand whether the price can continue to rise or the bullish momentum is running out.
What are supports
Supports are formed in different ways. Generally, however, they fail to fall beyond a certain level; this means that, at that particular point (or zone), the buying outweighs the selling, and so the price rebounds several times. Generally, the more times this event is repeated, the more important and robust the support level will be created.
When the price reaches support, mainly 3 things can happen which are essential for technical analysis:
- Rebound – as the name implies, the price goes down until it reaches support but fails to break it, then bounces back up;
- Breaking support – in this case, the price manages to break the support level and continues to fall. Often, when a support is broken, the price drops to the lower support level;
- Steady-state behaviour is somewhere between a rebound and a break of support. It occurs when the price stays around the support level, slightly above or below it. After breaking support and then returning above and then below again, it oscillates around this level.
What are resistances
Price levels where resistance is created are significant to consider in the technical analysis of financial markets in a bullish phase. A ‘price exploration‘ situation is often created when resistance corresponds to a historical market high.
Definition: Price exploration in financial markets is when the interaction between buyers and sellers breaks free from supports, resistances, and other reference levels because they are not yet determined for that area of the chart. Once past previous highs, prices will freely go on to mark new levels never reached.
When, in the price chart, the market encounters resistance, three things can happen:
- Rebound – the price fails to break resistance and consequently stops its growth;
- Breaking resistance – when the bullish momentum is strong enough, the price can break resistance and continue to rise;
- Stationary behaviour – if the price movement neither has sufficient momentum to continue nor is reversed by intense selling pressure, then it remains stationary, oscillating around the resistance level;
How to Identify Supports and Resistances
Engulfing patterns are particularly useful for identifying supports. This term is used to identify two candles of opposite colour in which the second cancels the movement of the first. If the price undergoes an ascent or descent equal to or greater than that recorded with the previous candle (regardless of the time interval considered), it is likely that at the base of the last movement analysed, there is either support or resistance.
To identify supports and resistances, locating intermediate clusters on the chart areas where a movement generated by a significant volume stops for a limited time interval can be helpful. If the asset’s price under consideration has recorded several green daily candles interspersed with a red one, the latter could quickly become a support to watch out for.
How to identify supports and resistances with trendlines
Having understood supports and resistances, we need to find out how to exploit them for the technical analysis of Bitcoin charts or any other cryptocurrency. One of the most immediate methods for identifying supports and resistances is to draw trendlines, i.e., straight lines connecting two or more points on the chart. Let’s take a graphical example of support and one of resistance.
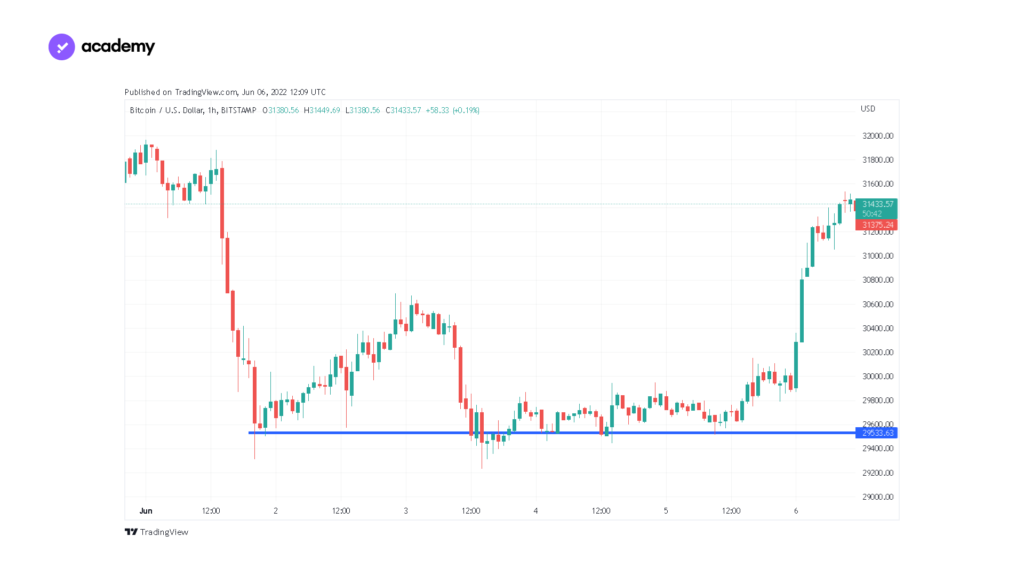
To identify support, use the blue line in the chart. Simply draw horizontal straight lines where you see the price rebound and start to rise again. Similarly, we will recognise resistance in the price rebound and subsequent descent, in the bullish phase.
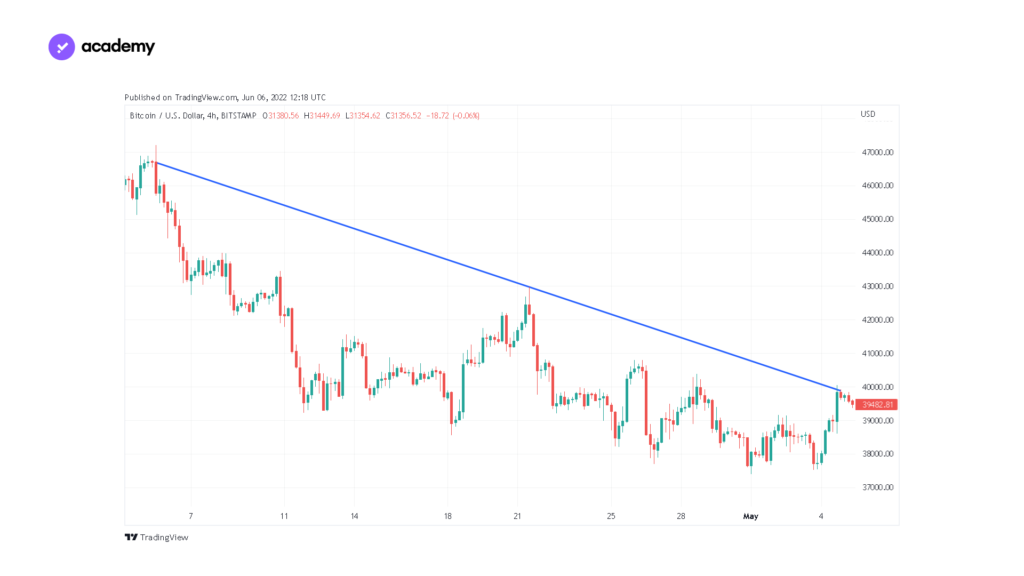
In this other image, however, you can see that it is possible to draw both horizontal and oblique lines. To find descending trendlines, you have to connect one low to the next one; to find ascending ones, you have to draw the line joining one high to the next one.
The psychological factor in support and resistance
An exceptional feature of both supports and resistances is that they are often found where the price is rounded to whole numbers, for example, 10,000 Euro or 50,000 Euro.
This is because price movements are strongly influenced by the psychology of individual traders, and clearly, round figures have a strong impact on people’s minds, which are affected by the mechanisms of mental accounting and other cognitive biases. Psychology in financial markets and trading is real, so the creation of supports and resistances is based on factual and concrete elements.
Around these price levels, many orders are usually placed, either limit or ‘stop’ orders, and trading is intense. As a result, we see the clash between buyers and sellers, which naturally and automatically creates the price movements typical of supports and resistances.
Related